- Role-based, attribute-based, & just-in-time access to infrastructure
- Connect any person or service to any infrastructure, anywhere
- Logging like you've never seen

In this final post of the tutorial, we will configure our bastion hosts to gather verbose logging data and send it off site to a cloud service.
The full tutorial is split into three parts:
Part 1: Creating your bastion hosts
- This post shows you how to create Linux virtual machines in Amazon Web Services, setup virtual networking, and create initial firewall rules to access the hosts.
Part 2: Managing SSH keys
- In this post, we will show you how to create an SSH key for your bastion host and look at ways you can streamline the bastion host login process without compromising the security of the key.
Part 3: Configuring hosts for logging
- How to configure our bastion hosts to gather verbose logging data and send it off site to a cloud service.
So far in this series, we have stood up two virtual bastion hosts, configured some initial firewall rules, and configured SSH access and SSH forwarding to allow for easier management of the systems. In this third and final part of this series, we will take a deep dive into configuring the hosts for logging verbose data, and then conclude by sending those logs off to a cloud provider for long-term storage and access.
Understanding the basic sources for audit information
Now that we have a bastion host and bastion guest to play with, lets go over some of the basic sources of information we might want to configure to create a logging and auditing system.
utmp
The utmp file keeps information about who is currently using the system, which is important since several users may be using our bastion host at the same time. Utmp also logs the system boot time, logins and logouts, and other important events. The files is typically located at /var/run/utmp.
wtmp
This file is a historical account of utmp activity, and located at var/log/wtmp.
btmp
The btmp file, typically located at /var/log/btmp, keeps track of failed login attempts.
Try running the last command which will, by default, display the contents of /var/log/wtmp:

Capturing login information to an aggregator
At the most basic level, you will want to find a way to capture authentication logs - both to the local bastion host as well as a secondary device. With this configuration, you will always have a long-term copy of your logs available - even if the bastion host is compromised. Since we’re using Linux in this example, we’ll use logging functionality built right into the operating system for this purpose. And we will use a free service called Papertrail as our off site storage target for the logs.
Once your Papertrail account is configured, click Settings → Log Destinations and take note of the server name. It will follow the format of logsX.papertrailapp.com:12345, where X is a host number and 12345 is a port number - both of which will vary. Next, follow this article, which will have you run the following command to figure out which logger your system uses:
ls -d /etc/*syslog*
Our AWS test system uses rsyslog, and the corresponding configuration file is located at /etc/rsyslog.conf. Open the config file:
nano /etc/rsyslog.conf
At the end of the file, insert the following line:
*.* @logsX.papertrailapp.com:12345
(Where X is your host number, and 12345 is the appropriate port number )
To begin shipping the logs to Papertrail, restart the rsyslog service:
sudo service rsyslog restart
To generate an event that should create a log event, attempt an SSH connection from your system using a user that does not exist on your bastion host. For example:
ssh hacker@your.AWS.ip.address
Now in the Papertrail console, click Events and you will see these invalid login attempts captured:

Should your bastion host ever be compromised, you can use Papertrail’s logs as your “golden” audit trail to help you investigate and respond to the incident.
Adding verbosity to logs with audits
Setting up your systems to track login history and other key events is certainly helpful. However, you may wish to get more granular and capture information about the systems network requests or file/folder changes made by other users. For this level of granularity, a tool called auditd comes in extremely handy. On our Linux box, we can install auditd easily by issuing this command:
apt-get install auditd
Installing auditd brings along several other tools along with it as well (see this post for more details). To start using auditd, we can see what auditing rules are configured by typing:
sudo auditctl -l
No rules should be configured, as seen in this screenshot:

One file we might want to monitor for any changes is /etc/passwd, which keeps track of each user account on the system. To enable auditing on this file, type:
sudo auditctl -w /etc/passwd -p rwxa
To confirm the audit change, type sudo auditctl -l again. This time you should see the following:

In the same way, we can use auditctl to audit directories. For example, if we have a shared folder called /corp that we want to monitor, we can run:
sudo auditctl -w /corp
Again, we can run sudo auditctl -l to verify these changes:

Now, lets perform a change that auditd should log for us. We will use the touch command to create a new file in /corp:
touch /corp/test.txt
This command will create an empty file called test.txt in the /corp subfolder. Now, lets look at how this information was logged by issuing the ausearch command, which is part of the auditd toolkit:

From this output we see the time the event took place, the name of the file created, and the comm (command) that affected the file, which was touch in this case.
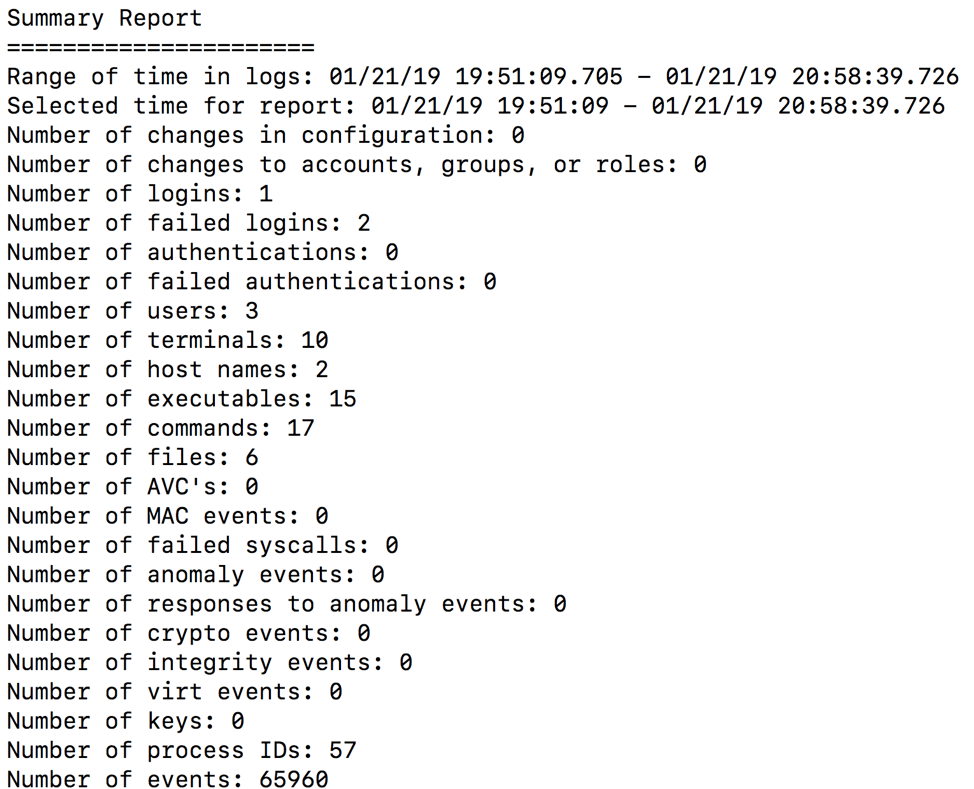
The auditd suite also allows you to run reports with a tool called aureport . Running aureport with no command switches gives you a summary report of the audit system log.

From this report we can see there were two failed login attempts. Using the aureport command with the -au flag will give us more detail:
aureport -au

From this report we can see that the user called boss failed authentication three times.
All the information that auditd is capturing gets saved to /var/log/audit/audit.log. Take a look at the latest log entries by using the tail command:
tail /var/log/audit/audit.log

As you can see, auditd captures a ton of detailed information about events happening on the system. You can even configure this log file to be captured by the rsyslog service talked about earlier. Keep in mind, though, that this avalanche of data can be overwhelming to try and interpret without the right tools. And due to the sheer number of events captured by auditd, you may find your SIEM chewing up a lot of storage space.
Monitoring users the “light” way
If you’re mostly concerned with just logging the commands users are issuing in their remote sessions, there’s another option that is quicker and easier to setup, but comes with some security concerns. First, open the /etc/profile file on your host:
nano /etc/profile
Next, paste in the following code to the end of the file on an empty line (source):
[#Record interactive sessions in terminal]
if [ "x$SESSION_RECORD" = "x" ]
then
timestamp=`date "+%m%d%Y%H%M"`
output=/var/log/session/session.$USER.$$.$timestamp
SESSION_RECORD=started
export SESSION_RECORD
script -t -f -q 2>${output}.timing $output
exit
fi
You probably don’t have a folder called /var/log/session so you can create it with the mkdir command:
mkdir /var/log/session
You will also need to change this folder’s permissions so that all users can write to it using the chmod command (this is a security concern as any user would have permissions to read and delete files in this folder):
chmod 777 /var/log/session
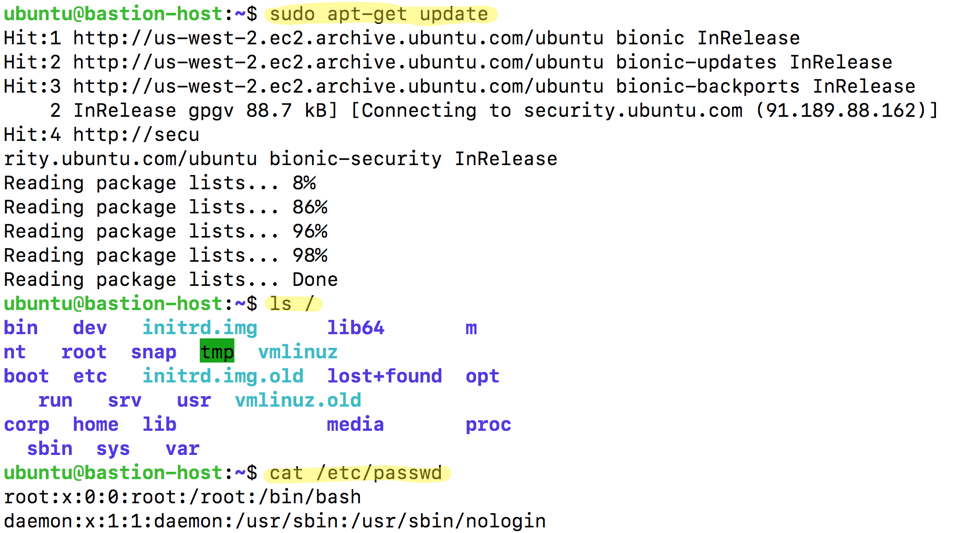
Now log out of your host and back into it. Run a few commands to generate some logs, such as:
sudo apt-get updatels /cat /etc/passwd
Now change directory to where these logs are stored with cd /var/log/session. List out the files in the directory:

Now we can use the more command to show us the captured input and output, one screen at a time:
more session.ubuntu.3949.012120192203

Challenges with self-managed bastion hosts
As you can see, creating a bastion host is a valuable but potentially complicated endeavor. Not only is there significant effort involved in configuring and tuning the host, but a number of security concerns that come along with those responsibilities as well. Before running a self-managed bastion configuration, you should ask yourself:
- Can I quickly and easily run a report of all logins on my system, or do I need to tie together a collection of shell scripts to do the job manually?
- Do I know who made changes to key files and settings on the system, and when those changed happened?
- Do I have a secure way to manage keys to this system?
- Am I capturing all this information to a secondary source in case of compromise or accidental data deletion?
- Can I log and audit other types of remote system connections, such as RDP and telnet?
- Have I created the necessary security policy, standard operating procedures and other documentation to regulate this system from an audit and compliance standpoint?
Alternative to a Bastion Host
StrongDM is a control plane to manage and monitor access to databases, servers, and Kubernetes. Their zero trust model means instead of distributing access across a combination of VPN, individual database credentials, and SSH keys, StrongDM unifies user management in your existing SSO (Google, Onelogin, Duo, Okta, etc...) and keeps the underlying credentials hidden. Neither credentials nor keys are accessible by end users. Because StrongDM deconstructs every protocol, it also logs all database queries, complete SSH and RDP sessions, and kubectl activity.
Try StrongDM with a free, 14-day trial or schedule a no-BS demo with our team.
To learn more on how StrongDM helps companies with auditing, make sure to check out our Auditing Use Case.
About the Author
Schuyler Brown, Chairman of the Board, began working with startups as one of the first employees at Cross Commerce Media. Since then, he has worked at the venture capital firms DFJ Gotham and High Peaks Venture Partners. He is also the host of Founders@Fail and author of Inc.com's "Failing Forward" column, where he interviews veteran entrepreneurs about the bumps, bruises, and reality of life in the startup trenches. His leadership philosophy: be humble enough to realize you don’t know everything and curious enough to want to learn more. He holds a B.A. and M.B.A. from Columbia University. To contact Schuyler, visit him on LinkedIn.

You May Also Like


