This article covers Kubernetes observability, its key tools, and best practices. You'll explore metrics, logs, and traces, learning how they provide deep insights. By the end, you'll know how to implement observability, select monitoring tools, and optimize cluster performance.
Key Takeaways
- Kubernetes Observability provides real-time insights into system health using metrics, logs, and traces to optimize performance and security.
- Three Pillars: Metrics track performance, logs capture event details, and traces map request flows across services.
- Why It Matters: Without observability, teams struggle to diagnose issues, optimize resources, and prevent downtime in complex Kubernetes environments.
- Essential Monitoring Tools: Open-source solutions like Prometheus, Grafana, Jaeger, and ELK Stack provide robust observability, while commercial platforms offer advanced analytics.
- Key Challenges: Managing scale, data volume, and cost while ensuring security and compliance is critical for effective observability.
What is Kubernetes Observability?
Kubernetes observability is the practice of monitoring and analyzing a Kubernetes environment through metrics, logs, and traces to gain visibility into system performance and health. It enables teams to detect and resolve issues proactively, optimize resource utilization, and maintain cluster reliability through real-time insights and automated monitoring tools.
The Three Pillars of K8s Observability
Modern Kubernetes environments generate massive amounts of operational data across your control plane and worker nodes. Making sense of this data requires mastering the three fundamental pillars of observability: metrics, logs, and traces.
Metrics provide quantitative measurements of system performance, from pod memory consumption to API server response times. These numerical indicators help teams track resource utilization and identify performance bottlenecks before they impact users.
Logs capture detailed records of events and activities across your containerized applications. By analyzing log data, developers can reconstruct the context of each event and troubleshoot issues within specific components.
Distributed traces track the flow of requests as they move through different services, giving you visibility into complex interactions between microservices and helping pinpoint the root cause of latency issues.
💡Make it easy: StrongDM simplifies access management across all three observability pillars, providing unified visibility into who accesses what data and when, while maintaining comprehensive audit trails for compliance requirements.
Why Observability Matters in Kubernetes
Modern organizations running Kubernetes face increasing complexity in their container environments. Without proper observability, performance issues can spiral into costly downtime and frustrated users. A comprehensive understanding of your Kubernetes state enables teams to detect and resolve problems before they impact business operations.
Effective observability provides actionable insights across your entire Kubernetes infrastructure. Teams can track resource utilization, identify bottlenecks in CI/CD pipelines, and ensure optimal performance across different Kubernetes distributions. This approach becomes particularly crucial when managing multiple clusters across various environments.
For DevOps teams, observability transforms reactive firefighting into proactive management. By understanding the big picture of your underlying infrastructure, you can optimize GitOps workflows and maintain reliable services.
💡Make it easy: StrongDM streamlines Kubernetes observability by providing unified access controls and audit trails across your entire container ecosystem.
Core Components of Kubernetes Observability
Metrics Collection and Analysis
Successful Kubernetes metrics collection requires a robust approach to gathering performance data across your distributed infrastructure. DaemonSets deploy monitoring agents on nodes to track essential metrics like CPU utilization, memory consumption, and network performance. For comprehensive cluster visibility, teams must monitor both infrastructure-level metrics and application-specific indicators through the Kubernetes dashboard.
Native monitoring tools expose metrics through the /metrics endpoint, while specialized collectors aggregate data from multiple sources. Modern observability platforms standardize this telemetry data, enabling teams to analyze trends and set meaningful performance baselines across their container ecosystem.
Log Management and Processing
Managing logs in Kubernetes environments requires a native observability strategy that can handle massive data volumes from containers and pods. Modern log processing tools transform raw event data into actionable insights through automated parsing and analysis. Teams must implement efficient log forwarding mechanisms to capture container stdout/stderr streams while maintaining minimal overhead on cluster resources.
Centralized log aggregation helps teams correlate events across distributed services and track application behavior at any point in time. By implementing proper log rotation and retention policies, organizations can balance comprehensive logging coverage with storage costs and performance impact.
Distributed Tracing Systems
Modern Kubernetes architectures demand robust tracing capabilities to track requests across microservices and containers. Teams must implement end-to-end tracing solutions that capture detailed transaction flows while maintaining minimal performance overhead. Popular tools like Jaeger provide essential visibility into service dependencies and latency bottlenecks.
Effective tracing strategies combine automated instrumentation with selective sampling to balance comprehensive coverage and system resources. By correlating trace data with metrics and logs, organizations can quickly identify and resolve performance issues across their container ecosystem.
💡Make it easy: StrongDM simplifies Kubernetes log management by providing unified access controls and audit trails for all logging infrastructure.
Essential Monitoring Tools for Kubernetes
Open Source Monitoring Solutions
Open source tools form the backbone of Kubernetes observability, with proven solutions offering comprehensive monitoring capabilities. The Kubernetes Dashboard provides essential insights into cluster health and resource utilization through a native web interface. Beyond basic metrics, specialized tools like Prometheus excel at time-series data collection, while Jaeger enables detailed request tracing across your container ecosystem.
Teams can leverage cAdvisor for container-specific metrics and the ELK Stack for centralized log analysis. These tools integrate seamlessly with existing Kubernetes services, enabling real-time monitoring without adding significant overhead to your infrastructure.
Commercial Observability Platforms
Enterprise organizations increasingly turn to commercial observability platforms for their Kubernetes environments, seeking unified visibility across complex containerized infrastructures. These platforms combine metrics, logs, and traces with advanced analytics and AI-powered insights, providing comprehensive monitoring capabilities beyond what open source tools offer individually.
Leading commercial solutions deliver automated anomaly detection, predictive analytics, and customizable dashboards that help teams proactively identify and resolve issues before they impact business operations. By integrating with existing DevOps toolchains, these platforms streamline workflow automation and enhance collaboration between development and operations teams.
Prometheus and Grafana Integration
Prometheus serves as the foundation for Kubernetes metrics collection, capturing time-series data through its powerful query language PromQL. When paired with Grafana's visualization capabilities, teams can transform raw metrics into actionable insights through customizable dashboards and alerts. This combination provides essential visibility into cluster health, resource utilization, and application performance.
Grafana enhances Prometheus data by enabling teams to create intuitive visualizations that track key performance indicators across your Kubernetes environment. Through native integration support, organizations can rapidly deploy monitoring solutions that scale with their infrastructure while maintaining granular control over metrics collection and visualization.
💡Make it easy: StrongDM simplifies access management across your monitoring stack—whether open source or commercial—by seamlessly integrating with tools like Prometheus and Grafana while enforcing strict security, compliance, and audit controls.
Building an Effective Observability Stack
ELK Stack Implementation
Deploying the ELK Stack for Kubernetes requires a strategic approach to handle diverse data streams across your container environment. Modern implementations leverage Elastic Cloud on Kubernetes (ECK) operator for seamless integration, replacing traditional Helm charts with native Kubernetes operators. This shift enables automated management of Elasticsearch clusters and simplified Kibana deployments.
Teams can configure Filebeat as a DaemonSet to collect container logs, while Metricbeat monitors cluster performance metrics. The centralized logging architecture provides real-time visibility into application behavior and cluster health through customizable Kibana dashboards.
Metrics Pipeline Architecture
Modern Kubernetes environments require a robust metrics pipeline to transform raw data into actionable insights. The pipeline architecture must handle data collection from multiple sources while ensuring minimal impact on cluster performance. By incorporating stream processing capabilities, teams can aggregate and analyze metrics in real-time, enabling rapid response to performance issues.
Effective pipeline design focuses on scalability and reliability, using buffering mechanisms to prevent data loss during high-load periods. Advanced architectures leverage edge computing to process metrics closer to their source, reducing network overhead and improving response times across distributed clusters.
Sidecars and Service Mesh
Service mesh architecture transforms Kubernetes observability by deploying proxy sidecars alongside each microservice. These sidecars intercept and manage all service-to-service communication, providing deep visibility into traffic patterns and performance metrics without modifying application code.
Modern service mesh implementations offer advanced observability features through their control planes, which centralize traffic management and security policies. Teams can monitor service health, track latency between components, and identify bottlenecks across their entire microservices ecosystem from a single interface.
💡Make it easy: StrongDM streamlines access management across your observability and service mesh infrastructure by automating provisioning, securely handling credentials, and enforcing granular access controls—all while maintaining comprehensive audit trails.
What Are the Challenges in Kubernetes Observability?
Scale and Performance Issues
As Kubernetes clusters expand, performance bottlenecks emerge from resource-intensive observability tools. High-cardinality metrics and frequent data sampling can strain cluster resources, potentially impacting application performance. Traditional monitoring approaches often struggle with the dynamic nature of container scaling, leading to gaps in visibility during rapid pod creation and termination.
Teams must balance comprehensive monitoring coverage with system overhead, particularly in production environments where performance is critical. Implementing efficient data sampling strategies and leveraging eBPF-based monitoring helps reduce resource consumption while maintaining visibility into cluster health.
Data Volume Management
Managing massive volumes of observability data presents unique challenges in Kubernetes environments. High-cardinality metrics and container logs can quickly overwhelm storage systems, while frequent pod creation and termination generate substantial trace data that needs efficient processing.
To handle this data deluge, organizations implement intelligent sampling strategies and data retention policies. Time-series databases with automatic downsampling help maintain historical data while preserving storage space. Advanced compression techniques and hot-cold storage tiers enable teams to balance accessibility with cost-effectiveness.
Cost Optimization Strategies
Organizations struggle to control their Kubernetes spending due to complex resource allocation and dynamic scaling. Traditional virtual machine cost models fail to address container-specific challenges like pod density optimization and namespace-level resource tracking.
Effective cost management requires both technical and organizational approaches. Teams need granular visibility into pod-level resource consumption, while implementing automated policies for idle resource cleanup and right-sizing container requests. Implementing quota management at the namespace level helps prevent resource hoarding and enables accurate cross-team billing.
Network Observability in Kubernetes
Container Network Monitoring
Network monitoring in containerized environments presents unique challenges as pods communicate through dynamic IP addresses and ephemeral network interfaces. Traditional monitoring approaches fail to capture the full scope of container-to-container communication patterns and service dependencies.
Modern Kubernetes deployments require visibility into pod-level network flows, including ingress and egress traffic patterns, DNS resolution metrics, and cross-namespace communication. Teams must monitor network policies effectiveness and track latency between services to maintain optimal application performance.
Network segmentation and microsegmentation strategies demand comprehensive monitoring to validate security policies and ensure proper traffic routing between containers. This includes tracking both east-west traffic within the cluster and north-south communication with external services.
Service Mesh Visibility
Service mesh implementations transform how organizations monitor and manage microservices communication. Modern Kubernetes environments demand complete visibility into service-to-service interactions, with proper observability tools tracking latency, error rates, and traffic patterns across the mesh.
Effective service mesh observability requires specialized approaches to handle the dynamic nature of container environments. Teams need real-time insights into proxy performance, routing decisions, and policy enforcement. This data helps identify bottlenecks, troubleshoot issues, and optimize service communication patterns.
Security Monitoring and Compliance
Audit Logging Best Practices
Robust audit logging forms the foundation of Kubernetes security governance and compliance validation. Organizations need comprehensive audit trails to track user actions, system changes, and resource access patterns across their container environments.
Successful audit logging strategies require careful consideration of log retention periods, storage locations, and access controls. Your audit logs must capture authentication attempts, privilege escalations, and configuration changes while maintaining tamper-proof records that meet regulatory requirements.
Security teams should implement centralized log aggregation to correlate events across clusters, enabling rapid incident investigation and compliance reporting. This approach helps organizations maintain detailed audit trails while managing storage costs and meeting retention requirements.
💡Make it easy: StrongDM audit logging capabilities provide tamper-proof records of all infrastructure access with automated retention policies and compliance reporting.
Threat Detection and Response
Real-time threat detection requires sophisticated monitoring of container behavior patterns and network anomalies across your Kubernetes environment. Organizations must implement automated response mechanisms that can identify and contain potential security breaches before they spread through the cluster.
Successful threat detection combines behavioral analysis with policy enforcement, monitoring pod creation patterns, privilege escalations, and unusual network connections. Teams need visibility into container runtime activities, including file system changes and process executions that could indicate compromise.
Rapid response capabilities should integrate with existing security workflows, allowing teams to quickly isolate affected workloads and prevent lateral movement through the cluster. This approach ensures minimal impact on production services while maintaining comprehensive security coverage.
Implementing Observability Best Practices
Node-Level Monitoring
Node monitoring forms the foundation of Kubernetes observability by tracking essential metrics across your worker nodes. CPU utilization, memory consumption, and disk I/O performance reveal the health of your container hosts, while network throughput measurements expose potential bottlenecks between nodes.
Modern Docker environments require monitoring agents that can capture both system-level metrics and container-specific data. Teams need visibility into node resource allocation, scheduling decisions, and capacity planning to maintain optimal cluster performance.
Application Performance Tracking
Modern Kubernetes deployments demand sophisticated performance tracking across microservices and containerized workloads. Teams struggle to maintain visibility into service dependencies, API latencies, and transaction flows that affect user experience.
Effective application performance monitoring requires correlation between infrastructure metrics and business-level KPIs. Organizations need to track response times, error rates, and throughput while understanding how these metrics impact service level objectives (SLOs) and customer satisfaction.
Resource Utilization Optimization
Optimizing resource utilization in Kubernetes requires balancing performance with cost efficiency. Organizations can enhance cluster efficiency through right-sizing containers and implementing automated scaling policies based on actual usage patterns. Resource quotas and limits at the namespace level prevent overallocation while ensuring fair distribution across teams.
Proactive monitoring of CPU saturation, memory consumption, and storage utilization enables teams to identify waste and implement targeted improvements. Setting up horizontal pod autoscaling based on custom metrics helps maintain optimal performance during varying workload conditions.
Creating Effective Kubernetes Dashboards
Metrics Visualization Strategies
Creating meaningful visualizations from Kubernetes metrics requires thoughtful dashboard design and data presentation strategies. Teams need to transform complex time-series data into actionable insights through customizable views that highlight system performance trends and potential issues.
Dashboard organization should follow a hierarchical approach, starting with cluster-wide health indicators before drilling down into namespace-specific metrics. Using heat maps for resource utilization and line graphs for historical trends helps operators quickly identify patterns and anomalies in their Kubernetes environments.
Alert Configuration
Alert configuration in Kubernetes environments demands a careful balance between comprehensive coverage and signal-to-noise ratio. Establishing meaningful alert thresholds requires a correlation between system metrics, application performance indicators, and business impact levels. Smart alert routing and grouping strategies help prevent alert fatigue while ensuring critical notifications reach the right teams.
Effective alert management incorporates automated escalation paths and context-rich notifications that include relevant troubleshooting data. Organizations must define clear severity levels and response procedures while maintaining flexibility for different operational scenarios and service-level objectives.
How StrongDM Enhances Kubernetes Observability
Secure, Seamless Access for Observability Tools
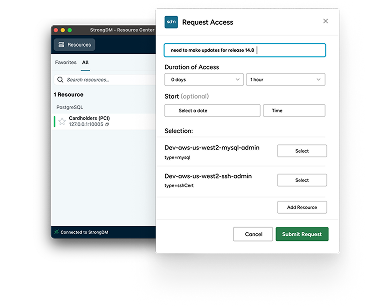
Observability in Kubernetes is only as effective as your ability to securely access and manage monitoring tools. StrongDM simplifies access management across Kubernetes observability stacks—whether using Prometheus, Grafana, Jaeger, ELK Stack, or commercial platforms—by providing a single control plane for infrastructure access.
With StrongDM, teams gain just-in-time, least-privilege access to logs, metrics, and traces without managing static credentials or complex RBAC policies. This ensures that engineers can securely monitor system health while minimizing the risk of unauthorized access.
Enforce Granular Security Without Slowing Down Engineering
Traditional access control solutions often introduce friction, forcing teams to choose between security and productivity. StrongDM eliminates this trade-off by offering zero-trust access that dynamically grants permissions based on real-time policies. Security teams can enforce role-based access control (RBAC), just-in-time provisioning, and automatic credential rotation—all without disrupting developer workflows.
Whether working with self-hosted or cloud-based Kubernetes clusters, StrongDM ensures secure access to observability tools without exposing credentials or requiring complex VPN setups.
Comprehensive Audit Trails for Compliance and Security
Visibility into who accessed observability data—and when—is critical for maintaining security and compliance. StrongDM provides detailed audit logs of every access request, enabling teams to track, monitor, and report on privileged activity across Kubernetes environments. This ensures compliance with SOC 2, HIPAA, GDPR, and other regulatory requirements.
Unlike traditional PAM solutions that create bottlenecks, StrongDM’s agentless, proxy-based architecture integrates directly with Kubernetes clusters, allowing real-time auditing without interfering with system performance.
Want to see how StrongDM simplifies Kubernetes observability and access management? Book a demo today!