- Role-based, attribute-based, & just-in-time access to infrastructure
- Connect any person or service to any infrastructure, anywhere
- Logging like you've never seen
Modern companies need to monitor data across many tools and applications, but few have the visibility necessary to see how those tools and applications connect. Data observability can help companies understand, monitor, and manage their data across the full tech stack. In this article, you’ll learn what data observability is, the differences between data observability, monitoring, and data quality, and what information you can track with data observability. By the end of this article, you’ll discover how to implement data observability and find the right data observability tools for your organization.
What is Data Observability?
Data observability is the ability to understand, diagnose, and manage data health across multiple IT tools throughout the data lifecycle. A data observability platform helps organizations to discover, triage, and resolve real-time data issues using telemetry data like logs, metrics, and traces.
Observability goes beyond monitoring by allowing organizations to improve security by tracking data movement across disparate applications, servers, and tools. With data observability, companies can streamline business data monitoring and manage the internal health of their IT systems by reviewing outputs.
Benefits of Data Observability
For organizations with many disconnected tools, observability monitoring can help IT teams gain insight into system performance and health. One of the primary data observability benefits is simplifying root cause analysis. By enabling end-to-end data visibility and monitoring across multi-layered IT architecture, teams can quickly identify bottlenecks and data issues no matter where they originate.
Data monitoring requires you to track pre-defined metrics to determine the health of your systems; for data monitoring to work, you have to know what issues you’re looking for and what information to track first. On the contrary, data observability allows teams to actively debug and triage their systems by monitoring a wide range of output. New insight into how data interacts with different tools and moves around your IT infrastructure can help teams identify improvements or issues they didn’t know to look for, leading to a faster mean time to detection (MTTD) and mean time to resolution (MTTR).
Prestored telemetry data makes it easy to automate security management, too. Data observability makes it possible to not only identify issues in real-time, but to automate parts of the triage process to instantly detect health issues or data downtime.
With this 360-degree view of your organization’s data, your company can maintain high data quality, enhance data integrity, and ensure data consistency across the full data pipeline. Ultimately, this makes it easier for organizations to deliver on service-level agreements (SLAs) and leverage high-quality data for analysis and decision-making.
Challenges of Data Observability
The right data monitoring system can transform how organizations manage and maintain their data. However, implementing data observability can pose challenges for some organizations, depending on their existing IT architecture.
Even the best observability tools can fall short without insight into the full data pipeline and all the software, servers, databases, and applications involved. Data observability can’t work in a vacuum, so it’s important to eliminate data silos and integrate all the systems across your organization into your data observability software. Some organizations struggle to gain the buy-in necessary to incorporate every system and tool into their observability solution.
Yet, even when all your internal and external data sources are integrated into your observability platform, different data models can present issues for your observability platform. Considering most organizations maintain an average of 400 data sources, it’s no surprise that the data from these sources may not abide by the same standards.
The best observability tools focus on standardizing telemetry data and logging guidelines to effectively correlate information, but depending on your data sources and custom data pipelines, standardizing data may take more manual effort with some data observability tools. Plus, depending on how your data is stored and your organization’s retention policies, some tools may come with untenable storage costs that limit scalability.
Data Observability Framework
To make agile DataOps a reality in your organization, it’s important to start with a data observability framework. An effective framework helps organizations foster a secure, data-driven culture and develop an observability strategy that promotes excellent data quality, consistency, and reliability.
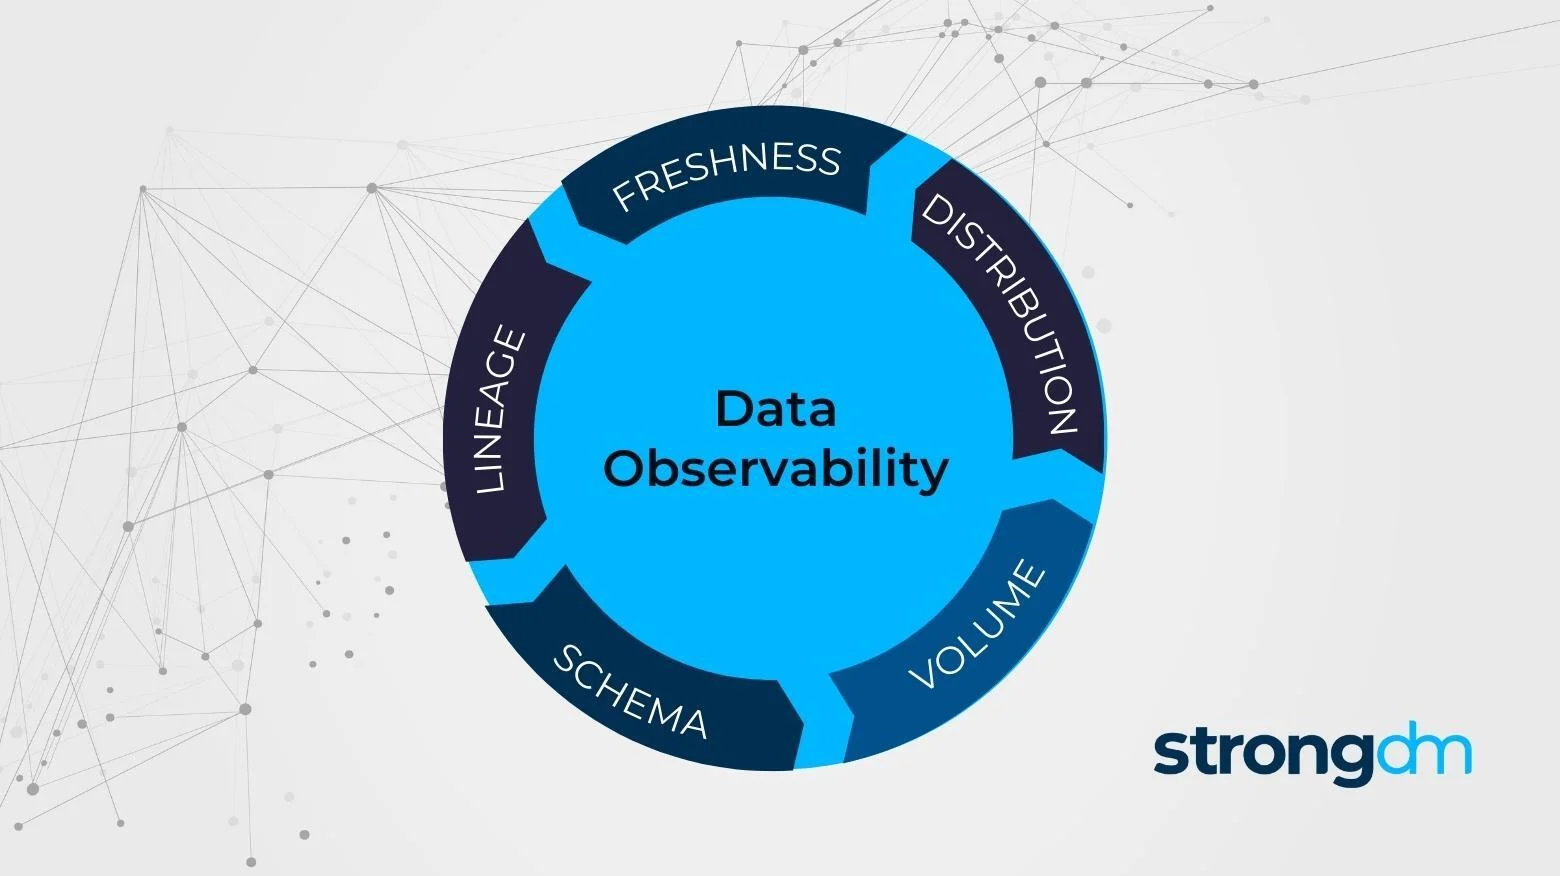
At its core, a data observability framework incorporates five pillars to ensure high data quality:
- Freshness: tracking how regularly your data is updated to eliminate stale data
- Distribution: recording what to expect of your data values to determine when data is unreliable
- Volume: tracking the number of expected values to confirm when your data is incomplete
- Schema: monitoring changes to data tables and data organization to identify broken data
- Lineage: collecting metadata plus mapping upstream data sources and downstream ingestors to troubleshoot where breaks occur and which teams have access to that data
Developing a framework around these five pillars enables organizations to manage their metrics, traces, and logs more effectively. Incorporating each pillar ensures that data quality improves while data remains visible from end to end within your data monitoring system.
From there, organizations need a standardized data platform to pull data from and a standardized library that defines data quality. Pulling data from multiple sources isn’t enough; your organization needs the infrastructure in place to produce consistent, standardized data while allowing you to pull data from APIs, support data lake observability, and facilitate regular queries to data warehouses.
While a data observability platform incorporates these elements, they must become part of your overall data management strategy to create the right culture around sharing data. Observability infrastructure gives teams a full view into end-to-end data across the organization, helping them detect and resolve data issues faster. As such, it’s important to set up the expectation that observability offers insight into system health across the organization to prepare your teams to collaborate. Otherwise, teams may resist streamlining their data into a centralized repository or working together to achieve peak observability.
What Can You Track with Data Observability?
The five pillars referenced above—freshness, distribution, volume, schema, and lineage—are important elements to help you monitor the health and performance of your datasets. However, these metrics only represent the tip of the iceberg of what’s possible with observability monitoring.
Data pipeline monitoring is a substantial benefit data observability platforms can offer. By tracking execution metadata and delays throughout your custom data pipelines, you can prevent data downtime and maintain consistent operational health across your IT systems. Duration, pipeline states, and retries offer more insight into the health and performance of your data pipelines so you can continuously access the observability your organization needs.
Column-level profiling and row-level validation offer even more insight into data performance across your system. Anomaly detection and business rule enforcement help identify issues before they impact data quality. A statistics summary can offer fine-tuned insight into the five pillars that make up your data observability framework.
All together, these observability metrics give comprehensive insight into your system’s overall health, potential incidents impacting individual elements of your system, and the overarching quality of your data.
Data Observability vs. Data Quality
When we consider data observability vs. data quality, it’s important to remember that data quality is crucial to successful observability. Observability depends on good data quality to be effective. However, a well-designed data observability framework and a supportive platform can help your organization improve its data quality over time.
Testing data quality can be difficult when you’re limited to application observability, software observability, or product observability alone. Full-stack observability tools allow your organization to improve data quality across your entire IT infrastructure by illustrating how different systems leverage the same data. Standardizing data is an important step companies should take to improve data quality, which shows why standardization is such a fundamental element of your data observability framework.
Yet, one-third of data analysts report spending over 40% of their time standardizing data to prepare it for analysis and 57% of organizations still find transforming their data to be an extremely challenging task. It’s clear that organizations need support to improve their data quality, and ultimately, data observability supports DataOps by setting standards to ensure your data is complete, delivered efficiently, and consistent. Data observability provides the context needed for organizations to proactively identify data errors, pipeline issues, and locate the source of inconsistencies to strengthen data quality over time.
Develop an Observability Strategy for Your Organization
Many organizations start with identifying the right data observability platform for their needs to bring data together across their full tech stack. Yet, implementing data observability goes beyond the tools you use. To implement data observability correctly, you should start with an observability strategy to prepare your team for the impact observability will have on their workflows.
Start by developing a data observability strategy and framework using the guidance in the “Data Observability Framework” section. The first priority is preparing your team to adopt a culture of data-driven collaboration. Consider how adopting a new observability tool and combining your data across teams may change how disparate teams work together.
Next, develop a standardization library to define what good telemetry data looks like. This will help your team standardize their metrics, logs, and traces across data lakes, warehouses, and other sources to seamlessly integrate these sources into your data observability tool. While you’re defining data standards, you can start developing governance rules like retention requirements and data testing methods to detect and remove bad data proactively.
Finally, choose an observability platform that works for your organization and integrate your data sources into that platform. You may need to build new observability pipelines to access the metrics, logs, and traces needed to gain end-to-end visibility. Add relevant governance and data management rules for your data, then correlate the metrics you’re tracking in your platform with your desired business outcomes. As you detect and address issues through your observability platform, you can discover new ways to automate your security and data management practices, too.
How to Choose the Right Data Observability Tool/Platform in 2025
At its core, a good observability tool must do three things:
- Collect, review, sample, and process telemetry data across multiple data sources
- Offer comprehensive monitoring across your network, infrastructure, servers, databases, cloud applications, and storage
- Serve as a centralized repository to support data retention and fast access to data
- Provide data visualization
But, the best observability tools go beyond these capabilities to automate more of your security, governance, and operations practices. Plus, they offer affordable storage solutions so your business can continue to scale as data volumes grow. Now that data volumes see an average growth of 63% every month, it’s crucial to consider an observability tool that supports your company’s ongoing needs.
To choose the right data observability tool, start by examining your existing IT architecture and finding a tool that integrates with each of your data sources. Look for tools that monitor your data at rest from its current source—without the need to extract it—alongside monitoring your data in motion through its entire lifecycle.
From there, consider tools that incorporate embedded AIOps and intelligence alongside data visualization and analytics. This allows your observability tool to support business goals more effectively as well as IT needs.
Ultimately, the right data observability tool for your organization depends on your unique IT architecture and observability engineering needs. Ideally, the best tool should be simple for your team to incorporate with their existing workflows and tools. Prioritize finding a tool that requires less up-front work to standardize your data, map your data, or alter your existing data pipelines for the best implementation experience.
What Does the Future of Data Observability Look Like?
As data volumes continue to grow, data observability will become even more essential for businesses of every size. More and more businesses are discovering the benefits that data-driven decision-making offers their operations, but they won’t be able to use that data effectively unless data quality is high. Increasingly, organizations will see that manually monitoring and managing data across multiple data sources poses a substantial risk to their organization’s health and decision-making processes. Data observability will take over as the predominant method to manage huge volumes of data, reduce data silos, and improve collaboration across the organization.
Data security is another concern that will drive the adoption of data observability. Tracking and monitoring data will become even more crucial as privacy laws increase the penalties for data mismanagement and companies continue to hold more sensitive data. These organizations will need help tracking data movement and proactively closing security gaps to prevent breaches. Combining AIOps with DataOps will become even more important when organizations need to respond quickly to breach threats. By decreasing MTTD and MTTR, companies can protect their data, collaborate effectively across teams, and spend less time finger-pointing in the war room when an issue arises.
Observability tools will continue to improve by supporting more data sources, automating more capabilities like governance and data standardization, and delivering rapid insights in real-time. These elements will help organizations support growth and leverage revenue-generating opportunities with fewer manual processes.
Transform Your Organization’s Monitoring Capabilities with Data Observability
Your organization handles huge volumes of valuable data every day. But without the right tools, managing that data can occupy excessive time and resources. Growing data volumes make it more important than ever for companies to find a solution that streamlines and automates end-to-end data management for analytics, compliance, and security needs.
StrongDM seamlessly integrates with many data observability tools to expand your visibility into user access. Our Infrastructure Access Platform supports your data observability platform to provide exceptional monitoring and visibility capabilities into how users are accessing and using your data.
Want to learn more? Get a free no-BS demo of StrongDM.
About the Author
John Martinez, Technical Evangelist, has had a long 30+ year career in systems engineering and architecture, but has spent the last 13+ years working on the Cloud, and specifically, Cloud Security. He's currently the Technical Evangelist at StrongDM, taking the message of Zero Trust Privileged Access Management (PAM) to the world. As a practitioner, he architected and created cloud automation, DevOps, and security and compliance solutions at Netflix and Adobe. He worked closely with customers at Evident.io, where he was telling the world about how cloud security should be done at conferences, meetups and customer sessions. Before coming to StrongDM, he lead an innovations and solutions team at Palo Alto Networks, working across many of the company's security products.

You May Also Like
