Three Pillars of Observability Explained: Metrics, Logs, Traces

Written by
John MartinezLast updated on:
June 25, 2025Reading time:
Contents
Built for Security. Loved by Devs.
- Free Trial — No Credit Card Needed
- Full Access to All Features
- Trusted by the Fortune 100, early startups, and everyone in between
Summary: In this article, we’ll focus on the three pillars of observability. You’ll learn about the definitions, strengths, and limitations of each pillar. By the end of this article, you’ll know about their individual contributions and typical real-world challenges, tying them together for an overall view of your system.
What Are the Three Pillars of Observability?
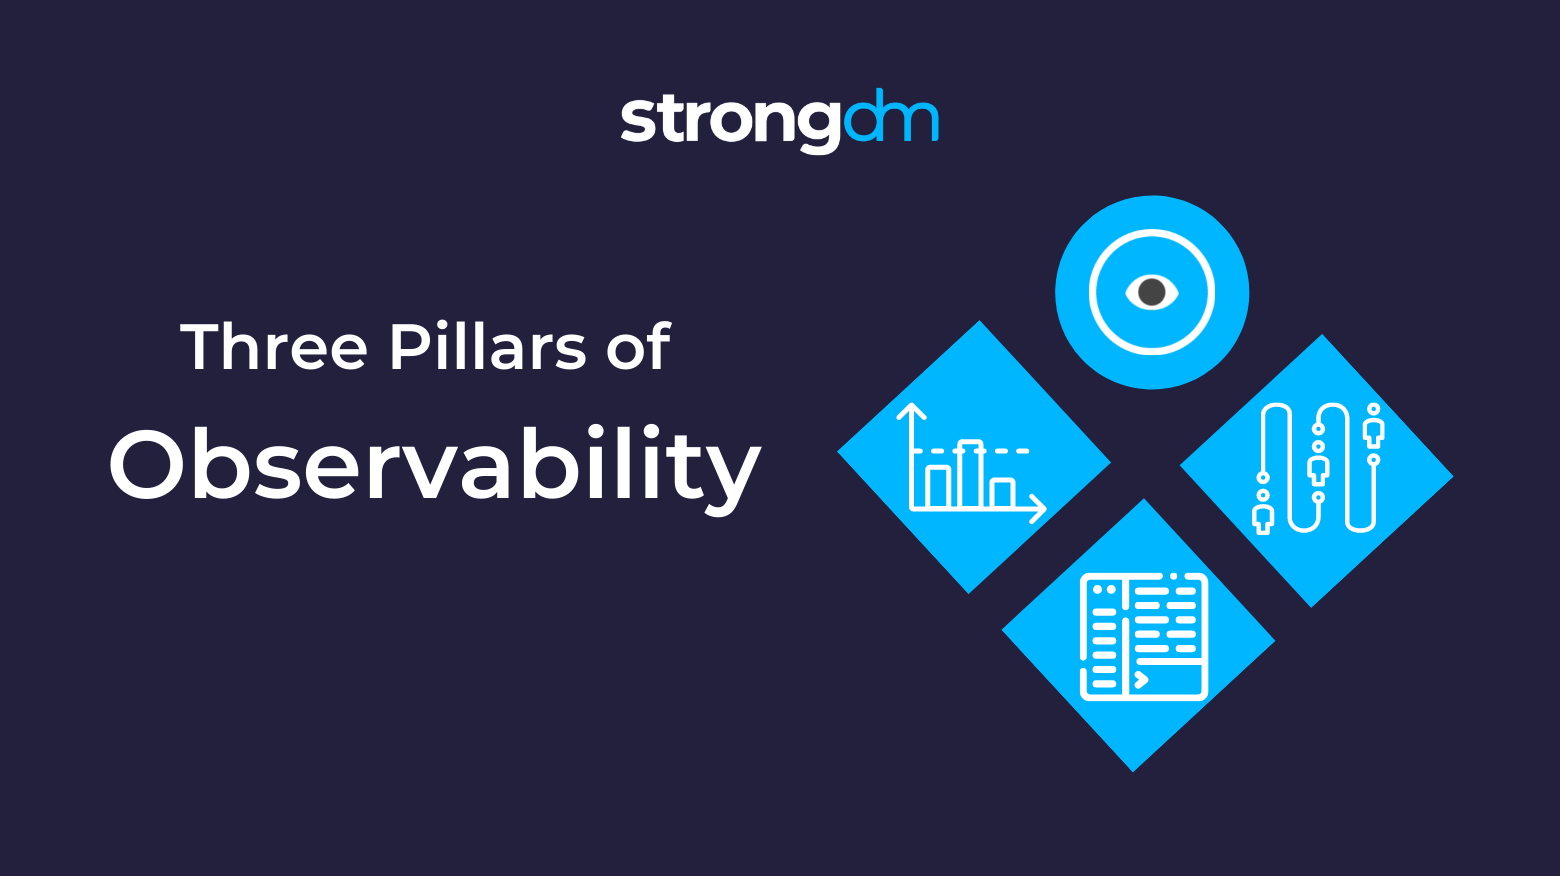
The three pillars of observability are metrics, logs, and traces. These three data inputs combine to offer a holistic view into systems in cloud and microservices environments to help diagnose problems that interfere with business objectives.
There was once a time when simple monitoring of internal servers was all companies needed to process errors and solve system problems. Monolithic architecture dominated, and clients connected to user interfaces directly. But times have changed. Business intelligence, data access layers, and app services are now often independently deployed, third-party microservices—making it increasingly difficult for teams to monitor where and when outages happen. In an observability architecture, it’s possible to identify where the problem is regardless of where the servers are.
System observability, having a birds-eye view of off-site components and the communications between them, is the first step in identifying problems in a distributed environment. Why is data observability needed? Put simply: we can’t monitor what we can’t observe, nor can we analyze it. Combining the three pillars of observability helps DevOps and SRE teams get the data they need to deploy an observability architecture. It accelerates time to market and pinpoints root causes of system failures. You might even call these pillars the Golden Triangle of Observability.
| Metrics | Logs | Traces | |
|---|---|---|---|
| Definition | Quantitative data providing insights on system performance and health. | Record of discrete events detailing system operations, often timestamped. | Record of a series of events or requests showing the journey through a system. |
| Primary Use | Monitoring and alerting based on system performance indicators. | Historical analysis of "who, what, where, when, and how" of system operations. | Analyzing the flow and performance of requests across a distributed system. |
| Strengths | - Real-time monitoring and alerting - Quantifiable performance data |
- Detailed event recording with context - Beneficial for forensic analysis |
- Visual mapping of request flows - Identification of bottlenecks and latencies |
| Limitations | - Difficult to diagnose without additional context - High data cardinality issues |
- Large volumes increase complexity and cost - Hard to manage in microservices systems |
- Requires sampling due to high data volume - Lacks code-level detail |
| Real-world Issues | Managing high cardinality and computing resources needed for extensive tag data. | Difficulty in log aggregation and indexing in decentralized architectures. | Tracing complexity and cost in capturing and analyzing every transaction in microservices. |
| Best For | Rapid detection and response to known issues based on predefined thresholds. | Investigating specific past events with detailed contextual information. | Understanding interactions and performance issues across multiple services. |
| Visualization | Typically visualized as dashboards showing metrics like CPU usage, response times, etc. | Logs are often analyzed through queries in log management tools; less visual. | Visual timelines showing steps in a transaction or process. |
| Interdependencies | Often used in conjunction with logs and traces to provide a full system overview. | Provides context missing from metrics, used alongside traces for deeper insights. | Complements logs and metrics by adding the sequence and performance context. |
Pillar 1: Metrics
Observability metrics encompass a range of key performance indicators (KPIs) to get insight into the performance of your systems. If you’re monitoring a website, metrics include response time, peak load, and requests served. When monitoring a server, you may look at CPU capacity, memory usage, error rates, and latency.
These KPIs offer insight into system healthandperformance. They quantify performance, giving you actionable insights for improvements. Metrics also afford the potential for alerts so that teams can monitor systems in real-time (e.g., when a service is down or when load balancers reach a specific capacity). Metric alerts can also monitor events for anomalous activities.
Limitations of Metrics
Diagnosing an event is difficult using only metrics. Grouping metrics by tags, filtering tags, and iterating on the filtering process is challenging, especially in a real-world scenario with thousands of values for a tag. Adding tags to a metric drastically increases the cardinality of your data set—the number of unique combinations of metric names and tag values.
In monitoring, tags with high cardinality could mean thousands of unique combinations of tags. The system can get cost-prohibitive quickly due to the amount of computing power and storage requirements needed to accommodate all the data generated. Though adding tags is crucial in understanding where a problem occurred, it’s a major undertaking.
Pillar 2: Logs
Logs have been a tool of monitoring since the advent of servers. Even in a distributed system, logs remain some of your systems’ most useful historical records. They come with timestamps and are most often binary or plain text. You may also have structured logs that combine metadata and plain text for easier querying. Logs offer a wealth of data to answer the “who, what, where, when, and how” questions with respect to access activities.
In a decentralized architecture, you’ll want to send logs to a centralized location to correlate problems and save yourself from accessing logs for every microservice or server. You’ll also have to structure log data, as each microservice might use a different format, making logs increasingly difficult to aggregate across all your systems.
Limitations of Logs
Logs provide a great amount of detail, so they can be challenging to index. Plus, logging functions that were easy on single servers become more complex in a microservices environment. Both data volume and costs increase dramatically. Many companies struggle to log every single transaction, and even if they could, logs do not help show concurrency in microservices-heavy systems.
Logs vs. Metrics
When logs become too unwieldy, metrics can simplify things. They are similar to logs in that they find their way to a time-series database, but with far less extraneous information. The difference between logs and metrics is that metrics only contain labels, a measurement, and a timestamp. In this case, metrics are more efficient, simple to query, and have longer retention periods. Teams will lose the granularity of logs, but gain efficiency and ease of storage.
Pillar 3: Traces
Traces are a newer concept designed to account for a series of distributed events and what happens between them. Distributed traces record the user journey through an application or interaction then aggregate that data from decentralized servers. A trace shows user requests, backend systems, and processed requests end-to-end.
Distributed tracing is useful when requests go through multiple containerized microservices. Traces are easy to use as they are generated automatically, standardized, and show how long each step in the user journey takes. Traces show bars of varying length for each step, making it possible to follow requests visually.
Traces are also helpful for identifying chokepoints in an application. According to Google’s former distributed tracing expert, Ben Sigelman, distributed traces are the best reverse engineering tool for diagnosing the complicated interference between transactions that are causing issues.
Limitations of Traces
Traces merge some features of both logs and metrics, enabling DevOps admins to see how long actions take for app users. For example, traces might show:
- API Queries
- Server to Server Workload
- Internal API Calls
- Frontend API Traffic
Which part is slow? Traces help locate the problematic section.
But costs can undermine the process, so tracing must be sampled. In other words, collecting data about each and every request, then transmitting and storing it, can be prohibitive. Deciding to take a small subset (i.e., a sample) and analyze that subset of data is more logical. But which data to sample? Traces require a complicated sampling strategy and the know-how to interpret the resulting data.
Traces vs. Logs
When it comes to traces vs. logs, it’s important to remember that logs are a manual developer tool. Developers can decide what and how to log and are tasked with reconciling logs, defining best practices for their objectives, and standardizing format. That makes them flexible but prone to human error.
Traces are better than logs at providing context for events, but you won’t get code-level visibility into problems as you would with logs. Traces are automatically generated with data visualization. That makes it easier to observe issues and faster to fix them. They lack flexibility and customizability, but they’re designed to go deeper into distributed systems where logs can’t reach.
The Problem with the Three Pillars of Observability
Because each pillar has gaps, companies can deploy all three and find they haven’t achieved all their observability objectives and certainly haven’t solved real-world business problems. Here are some typical observability problems that often remain even after embracing each type of input:
- There are too many places to look for problems: Problems show up in multiple microservices because of dependencies in a complex system, which can trigger excessive alerts on a reporting dashboard. Admins need tools to help cut through this noise and troubleshoot alerts more efficiently.
- Companies need the ability to drill down: The problem with a complex stack of microservices is that many depend on their own sets of microservices. When any one of those fails, you want to rule out your top-level microservices and easily see where the actual error lies.
- The pillars are not visual, but patterns are: Looking at a dashboard of metrics, logs, and traces may provide helpful information, such as aggregating measurements into percentiles. But percentile reporting can obscure problems at the tail end of distributions, and developers may never see issues in the entire distribution without visualization of their complete data set. Reporting tools can address the gap between the data and how easy it is to visualize.
How the Three Pillars of Observability Work Better Together
The problems with the three pillars aren’t with any individual pillar itself, but with the complexity of transforming them into real insight. The three pillars contribute different views to an overall system and don’t work well in isolation. Instead, their collective value lies in an analytics dashboard where one can see the relationships between the three. Why? Because observability does not come from completing a checklist. Teams want to utilize pillars within an overarching strategy.
Using SLOs for a Complete Topography
Stop thinking about the three pillars as an end unto themselves. Instead, these inputs are a means to elevate business goals your users care about. Is it throughput? Latency? If we want a user’s search results returned quickly, how fast should it be? Google’s SRE book suggests that the goals of observability align with Service Level Objectives (SLOs), the indicators of system health that improve customer experience. Those depend on making decisions about user expectations rather than simply observing what can be measured. This approach helps make the best of the three pillars, contextualizing them with measurable, objective-based benchmarks.
Going Beyond the Three Pillars
The three pillars are ultimately types of valuable data, but raw data in unsearchable volumes does little for companies that need advanced predictive analytics. The solution is not less data—it’s less noise. While tools and integrations solve many problems, AI models can take users beyond the limits, parsing the data for better pattern recognition and a faster path to solutions.
For tech giants that need better ways to see system problems wherever they happen, alerts and visualizations comprise the fourth pillar of observability. Indeed, we need better ways to see system problems wherever they happen. That’s the real observability dilemma.
In the end, the three pillars of observability are the heart of great customer experiences, but only if teams gain insights from the data they’re gathering. Developing objectives aligned with real customer needs, monitoring the right items, cutting through data overload, and pinpointing problems quickly are all key to unlocking the utility of the three pillars.
How to Achieve True Distributed Systems Observability
Distributed systems observability goes beyond implementing a dashboard with three different input types. It’s about gaining real insight into your company’s systems, vetting hypotheses quickly, and giving your teams actionable insight to solve problems faster.
Want to know how that could look? Sign up for our no-BS demo.
Next Steps
StrongDM unifies access management across databases, servers, clusters, and more—for IT, security, and DevOps teams.
- Learn how StrongDM works
- Book a personalized demo
- Start your free StrongDM trial
Categories:

About the Author
John Martinez, Technical Evangelist, has had a long 30+ year career in systems engineering and architecture, but has spent the last 13+ years working on the Cloud, and specifically, Cloud Security. He's currently the Technical Evangelist at StrongDM, taking the message of Zero Trust Privileged Access Management (PAM) to the world. As a practitioner, he architected and created cloud automation, DevOps, and security and compliance solutions at Netflix and Adobe. He worked closely with customers at Evident.io, where he was telling the world about how cloud security should be done at conferences, meetups and customer sessions. Before coming to StrongDM, he lead an innovations and solutions team at Palo Alto Networks, working across many of the company's security products.
You May Also Like
